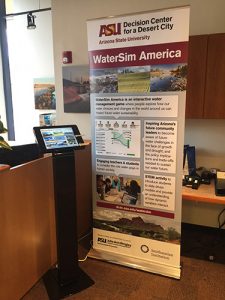
WaterSim America
Expanding the modeling effort of WaterSim Phoenix, DCDC’s WaterSim America model is a unique hands-on, state-of-the-art immersive visualization tool used to explore the complexity of water supply and demand. WaterSim America explores water issues on a state level and has been implemented as a proof-of-concept exhibit within Smithsonian’s Museum on Main Street Water/Ways exhibition.
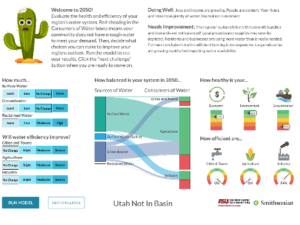
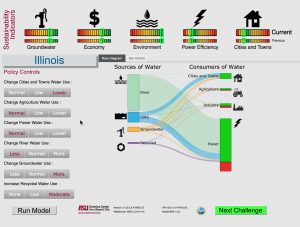
The interactive, educational game challenges visitors to develop custom sustainability solutions to specific water management issues in their own state. Learning from professionally-produced videos, engaging graphics, and an intuitive and simple-to-use interface, exhibition visitors select from a variety of realistic solutions to balance water supplies and demands. Sustainability indicators help users to understand the trade-offs they face between water conservation, agriculture, economic development, and environmental preservation.
Water/Ways Exhibition
The Smithsonian’s Water/Ways exhibition dives into water–an essential component of life on our planet, environmentally, culturally, and historically.
In societies across the globe, water serves as a source of peace and contemplation. Many faiths revere water as a sacred symbol. Authors and artists are inspired by the complex character of water – a substance that is seemingly soft and graceful that is yet a powerful and nearly unstoppable force.
Water also plays a practical role in American society. The availability of water affected settlement and migration patterns. Access to water and control of water resources have long been a central part of political and economic planning. Human creativity and resourcefulness provide new ways of protecting water resources and renewing respect for the natural environment.
This nationwide exhibition travels to 24 states and 180 rural communities from 2016-2020. Water/Ways will tour Arizona from June 2018-March 2020.
Water/Ways National Tour Schedule
- May 2016-April 2017: Florida, Illinois, Minnesota, Idaho, and Wyoming
- May 2017-April 2018: Virginia, Alabama, Tennessee, Kansas, and Guam
- May 2018-April 2019: Arizona, Louisiana, Michigan, Mississippi, and Nebraska
- May 2019-April 2020: Arizona, Oklahoma, New Jersey, Maryland, and Texas
- May 2020-April 2021: South Carolina, Missouri, California, Utah, and North Carolina
Data Sources for Water Sustainability Indicators
Developed by researchers at Arizona State University, the model uses the following data sources for water sustainability indicators.
- Groundwater
- Total Groundwater Withdrawal as a % of Safe Yield Estimates
- GRACE, JPL; Global Land Data Assimilation System, NASA; National Snow and Ice Data Center, University of Colorado Boulder
- Surface Water
- Withdrawal by Water Treatment Plants as a % of Stream Flows
- Water Use, Surface Water, USGS; Water Treatment Plant Data, EPA
- Economy
- Data for this indicator was provided to us by Dr. Benjamin Ruddell at Northern Arizona University, in association with the NSF-funded NWEP and FEWSION projects.
- Local Water Used for Goods Production as a % of Total Water Use
- Freight Analysis Framework, FHWA USDOT; Water Use, USGS; Employment Population, US Census; Agricultural Acreage, NASS USDA


- Environment
- Wastewater Discharge as a % of Total Stream Flow
- Surface Water, USGS; Wastewater Treatment Plants, EPA
- Agriculture Efficiency
- Gallons Per Dollar of Agriculture Production Per Day
- Water Use and Power, USGS; Net Farm Income, NASS USDA
- Urban/Rural Efficiency
- Gallons Per Capita Per Day
- Water Use and Population, USGS
- Power Efficiency
- Gallons Per Megawatt of Power Produced Per Day
- Water Use and Power Production, USGS